Placer County Market Update – July 2018
July 2018 was a Seller’s market in Placer County!
NorCal Note: Even though July was a Seller’s Market, some of these numbers and figures should be read carefully because they’re pretty significant. We’re seeing some major changes in the market!
All of these figures are pulled directly from MLS.
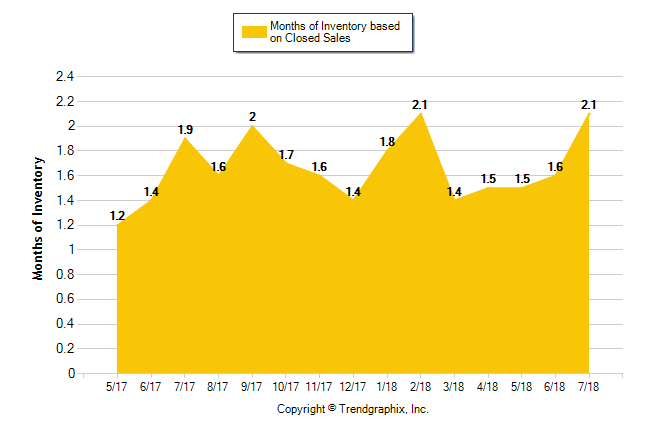
The number of for sale listings was up 5.9% from one year earlier and up 3.6% from the previous month. The number of sold listings decreased 6.8% year over year and decreased 21% month over month. The number of under contract listings was down 4.8% compared to previous month and down 5.3% compared to previous year. The Months of Inventory based on Closed Sales is 2.1, up 10.7% from the previous year.
The Average Sold Price per Square Footage was up 1.2% compared to previous month and up 7.9% compared to last year. The Median Sold Price decreased by 2.4% from last month. The Average Sold Price also increased by 1.6% from last month. Based on the 6 month trend, the Average Sold Price trend is “Neutral” and the Median Sold Price trend is “Neutral”.
The Average Days on Market showed a neutral trend, an increase of 20.8% compared to previous year. The ratio of Sold Price vs. Original List Price is 97%, a decrease of 1% compared to previous year.
It is a Seller’s Market
Property Sales (Sold)
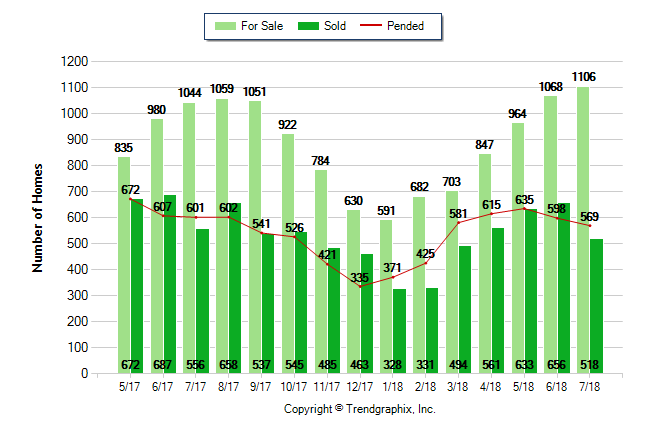
July property sales were 518, down 6.8% from 556 in July of 2017 and 21% lower than the 656 sales last month.
Current Inventory (For Sale)
Versus last year, the total number of properties available this month is higher by 62 units of 5.9%. This year’s bigger inventory means that buyers who waited to buy may have bigger selection to choose from. The number of current inventory is up 3.6% compared to the previous month.
Property Under Contract (Pended)
There was a decrease of 4.8% in the pended properties in July, with 569 properties versus 598 last month. This month’s pended property sales were 5.3% lower than at this time last year
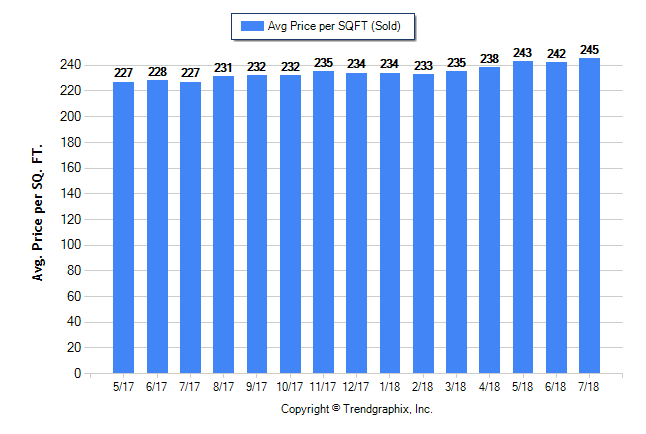
The Average Sold Price per Square Footage is Appreciating*
The Average Sold Price per Square Footage is a great indicator for the direction of property values. Since Median Sold Price and Average Sold Price can be impacted by the ‘mix’ of high or low end properties in the market, the Average Sold Price per Square Footage is a more normalized indicator on the direction of property values. The July 2018 Average Sold Price per Square Footage of $245 was up 1.2% from $242 last month and up 7.9% from $227 in July of last year.
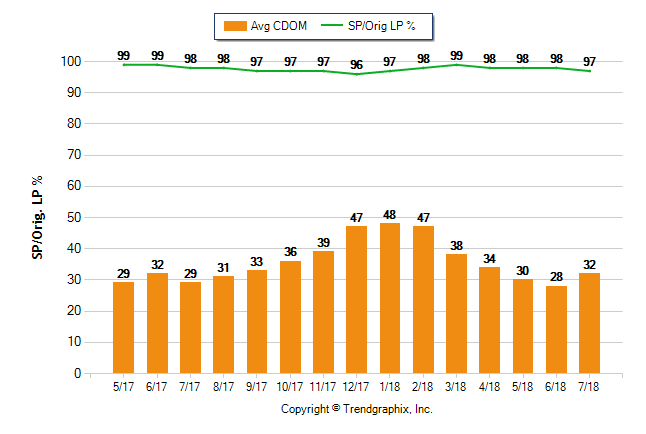
The Days on Market Shows Neutral Trend*
The average Days on Market (DOM) shows how many days the average property is on the market before it sells. An upward trend in DOM trends to indicate a move towards more of a Buyer’s market, a downward trend indicates a move towards more of a Seller’s market. The DOM for July 2018 was 29, up 16% from 25 days last month and up 20.8% from 24 days in July of last year.
The Sold/Original List Price Ratio Remains Steady**
The Sold Price vs. Original List Price reveals the average amount that sellers are agreeing to come down from their original list price. The lower the ratio is below 100% the more of a Buyer’s market exists, a ratio at or above 100% indicates more of a Seller’s market. This month Sold Price vs. Original List Price of 97% is down 1% % from last month and down from 1% % in July of last year.
The Average For Sale Price is Neutral*
The Average For Sale Price in July was $741,000, up 4.7% from $708,000 in July of 2017 and down 0.5% from $745,000 last month.
The Average Sold Price is Neutral*
The Average Sold Price in July was $559,000, up 10.7% from $505,000 in July of 2017 and up 1.6% from $550,000 last month.
The Median Sold Price is Neutral*
The Median Sold Price in July was $495,000, up 10% from $450,000 in July of 2017 and down 2.4% from $507,000 last month.
LINE GRAPH
It is a Seller’s Market*
A comparatively lower Months of Inventory is more beneficial for sellers while a higher months of inventory is better for buyers.
*Buyer’s market: more than 6 months of inventory
Seller’s market: less than 3 months of inventory
Neutral market: 3 – 6 months of inventory
Months of Inventory based on Closed Sales
The July 2018 Months of Inventory based on Closed Sales of 2.1 was increased by 10.7% compared to last year and up 30.7% compared to last month. July 2018 is Seller’s market.
Months of Inventory based on Pended Sales
The July 2018 Months of Inventory based on Pended Sales of 1.9 was increased by 11.5% compared to last year and up 5.6% compared to last month. July 2018 is Seller’s market.