Sacramento County Market Trends – June 2018
#TuesdayTrend
Sacramento County Market Update
Last month we broke down the market trends for May 2018 and now we’re heading into June! It’s always super interesting to see how the market changes from month to month.
Taking a look at June’s data juxtaposed with May’s, we’re seeing a very subtle slow down in the market. Most of the categories changed/decreased by less than 2%, but check out the Month’s Of Inventory (the last category), holy cow! Even though that number seems pretty darn high, looking at the graph you’ll notice that this kind of change isn’t totally uncommon… and 1.5 months is still really good! We only start to worry when that number gets closer to 2+ months.
Typically changes aren’t super drastic – but it’s not to say that’s always the case! Usually when there’s noticeable changes in the market in a short period of time, they coincide with some sort of catalyst. Things as simple as the changing of seasons or something a more substantial like a major election, can cause big changes in the way people are buying and selling homes.
Let’s take a look at what June brought to the Sacramento Real Estate Market. Just as before, all of these figures and images come directly from MLS and offer a comparison to what the market looked like this time last year.
June 2018 is a Seller’s market*
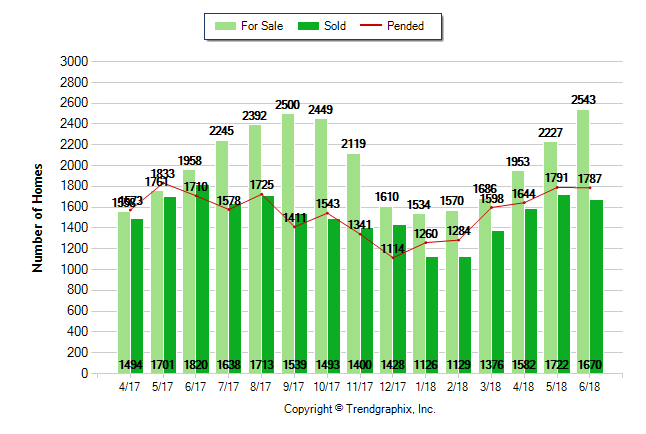
Home For Sale in June 2018: 2543 units.
| • | Up 14.2% compared to last month |
| • | Up 29.9% compared to last year |
Home Closed in June 2018: 1670 units.
| • | Down 3% compared to last month |
| • | Down 8.2% compared to last year |
Home Placed under Contract in June 2018: 1787 units.
| • | Down 0.2% compared to last month |
| • | Up 4.5% compared to last year |
June 2018 Average Sold Price per Square Footage is Neutral*
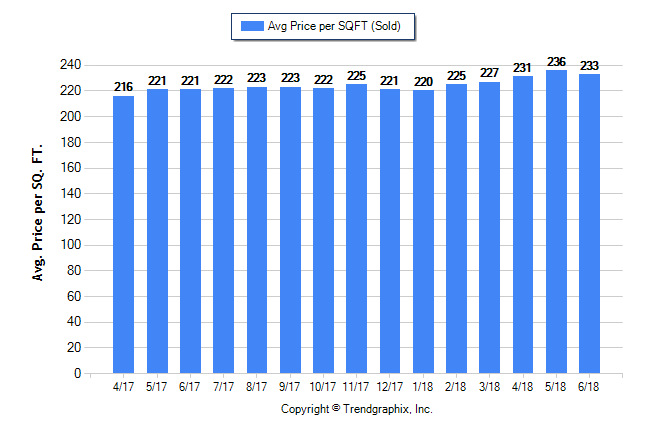
Average Sold Price per Square Footage in June 2018: $233
| • | Down 1.3% compared to last month |
| • | Up 5.4% compared to last year |
June 2018 Average Continuous Days on Market trend Remains Steady*
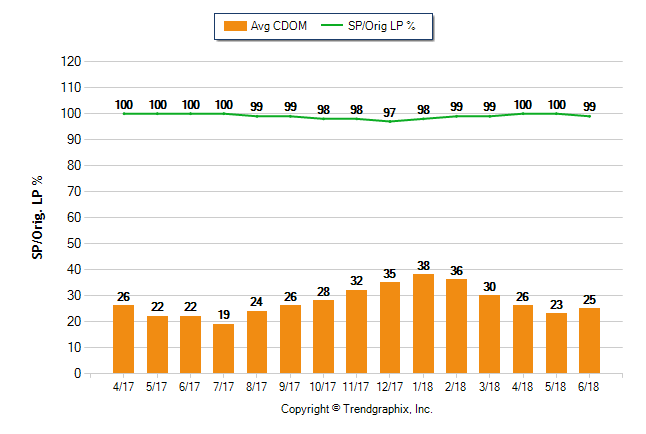
Continuous Days on Market in June 2018: 25
| • | Up 8.7% compared to last month |
| • | Up 13.6% compared to last year |
June 2018 Sold/Original List Price Ratio Remains Steady*
Sold/Original List Price % in June 2018: 99%
| • | Down 1% compared to last month |
| • | Down 1% compared to last year |
June 2018 Average For Sale Price is Neutral*
Average For Sale Price (in thousand) in June 2018: $505
| • | Down 1.8% compared to last month |
| • | Down 2.1% compared to last year |
June 2018 Average Sold Price is Neutral*
Average Sold Price (in thousand) in June 2018: $412
| • | Down 0.2% compared to last month |
| • | Up 8.1% compared to last year |
June 2018 is a Seller’s market*
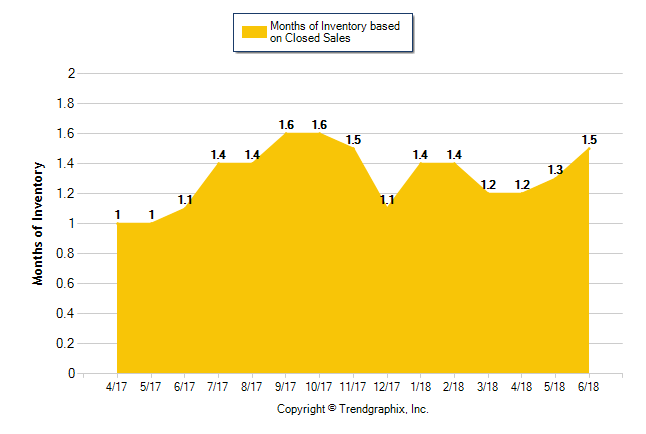
Months of Inventory based on Closed Sales in June 2018: 1.5
| • | Up 15.5% compared to last month |
| • | Up 37.2% compared to last year |