Yolo County Market Trends
#TuesdayTrend
Yolo County Market Trend: May 2018
Placer County, sit down! Yolo County… you’re up!
It’s that time again, the Tuesday Market Update. As always, all of these figures and images come directly from MLS and offer a comparison to what the market looked like this time last year. Next week, we’ll wrap up things up with both Nevada and El Dorado Counties before we look back on what June brought us.
Let’s do this!
For Sale vs. Sold
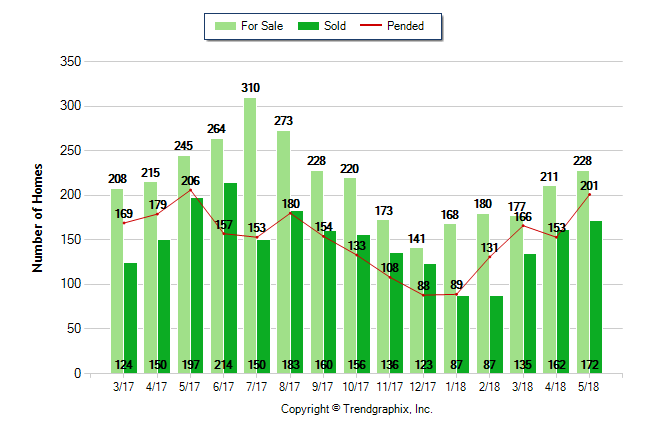
May 2018 is a Seller’s market*
Home For Sale in May 2018: 228 units.
| • | Up 8.1% compared to last month |
| • | Down 6.9% compared to last year |
Home Closed in May 2018: 172 units.
| • | Up 6.2% compared to last month |
| • | Down 12.7% compared to last year |
Home Placed under Contract in May 2018: 201 units.
| • | Up 31.4% compared to last month |
| • | Down 2.4% compared to last year |
Average Price Per Square Foot
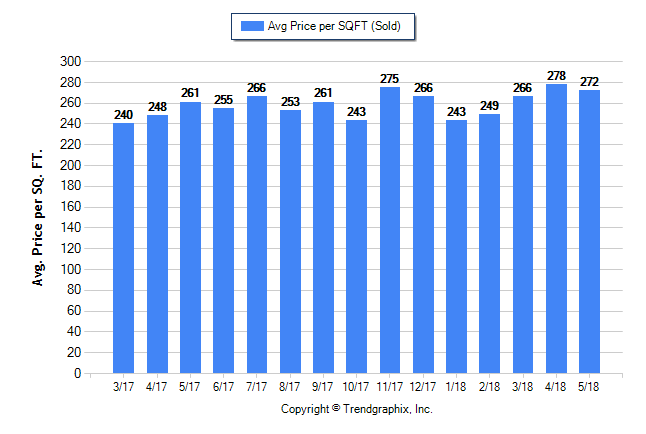
May 2018 Average Sold Price per Square Footage is Neutral*
Average Sold Price per Square Footage in May 2018: $272
| • | Down 2.2% compared to last month |
| • | Up 4.2% compared to last year |
Days on Market – Sold/List Price Percentage
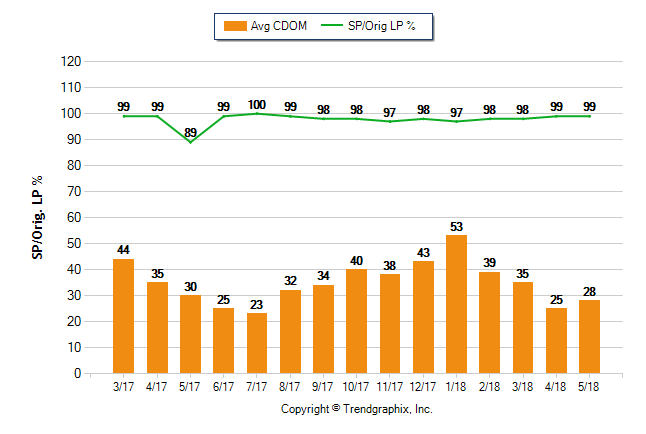
May 2018 Average Continuous Days on Market trend Remains Steady*
Continuous Days on Market in May 2018: 28
| • | Up 12% compared to last month |
| • | Down 6.7% compared to last year |
May 2018 Sold/Original List Price Ratio is Rising*
Sold/Original List Price % in May 2018: 99%
| • | 0% compared to last month |
| • | Up 11.2% compared to last year |
Average Price For Sale & Sold
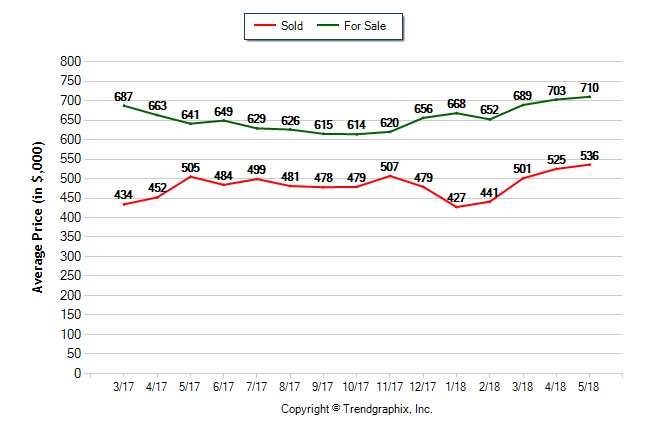
May 2018 Average For Sale Price is Appreciating*
Average For Sale Price (in thousand) in May 2018: $710
| • | Up 1% compared to last month |
| • | Up 10.8% compared to last year |
May 2018 Average Sold Price is Appreciating*
Average Sold Price (in thousand) in May 2018: $536
| • | Up 2.1% compared to last month |
| • | Up 6.1% compared to last year |
Months of Inventory
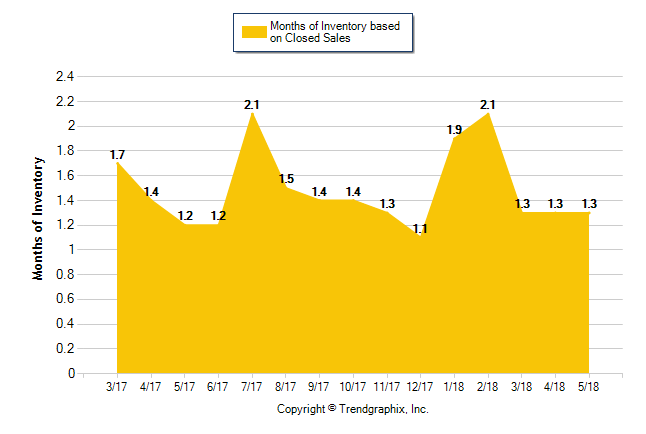
May 2018 Average For Sale Price is Appreciating*
Average For Sale Price (in thousand) in May 2018: $710
| • | Up 1% compared to last month |
| • | Up 10.8% compared to last year |
May 2018 Average Sold Price is Appreciating*
Average Sold Price (in thousand) in May 2018: $536
| • | Up 2.1% compared to last month |
| • | Up 6.1% compared to last year |