NorCal Homes December Market Update
 Although the market is beginning to slow down, we closed out 2016 in a Seller’s Market.
The number of homes on the market decreased by nearly 25%, but the number of homes closed during the same amount of time when nearly unchanged. Compared to last year, the number of homes placed under contract in the month of December increased 25%. The average price per square foot in Sacramento County held steady from November to December at an average price of $202.00 per sqft. Homes remained active on the market longer in December, but seller’s were still getting an average of 97% of their asking price. There was a very minimal increase in the average list price across the county from month to month, but prices were up almost 7.5% from this time in 2015. That being said, sold prices took a slight dip from month to month. The number of months of inventory dropped dramatically from month to month, making a more competitive climate for buyers, while working in the seller’s favor.
Take a look below to dive a little deeper into the statistics provided by MLS.
| December 2016 is a Seller’s market*
Home For Sale in December 2016: 1510 units.
Home Closed in December 2016: 1428 units.
Home Placed under Contract in December 2016: 1192 units.
*Buyer’s market: more than 6 months of inventory based on closed sales |
||||||||||||||
December 2016 Average Sold Price per Square Footage is Depreciating* Average Sold Price per Square Footage in December 2016: $202
*Based on 6 month trend – Appreciating/Depreciating/Neutral |
||||||||||||||
| December 2016 Average Continuous Days on Market trend is Rising*
Continuous Days on Market in December 2016: 39
December 2016 Sold/Original List Price Ratio is Falling* Sold/Original List Price % in December 2016: 97%
*Based on 6 month trend – Rising/Falling/Remains Steady |
||||||||||
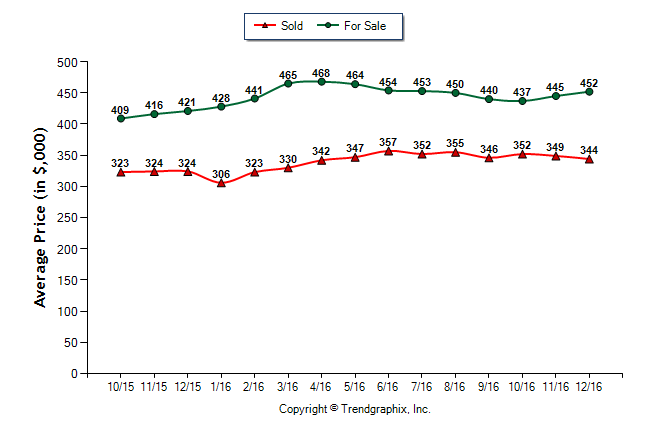
| December 2016 Average For Sale Price is Neutral*
Average For Sale Price (in thousand) in December 2016: $452
December 2016 Average Sold Price is Depreciating* Average Sold Price (in thousand) in December 2016: $344
*Based on 6 month trend – Appreciating/Depreciating/Neutral |
||||||||||
| December 2016 is a Seller’s market*
Months of Inventory based on Closed Sales in December 2016: 1.1
*Buyer’s market: more than 6 months of inventory based on closed sales |
||||||||||