Placer County Market Trends
#TuesdayTrend
Placer County Market Trends: May 2018
Last week we broke down the May 2018 Real Estate market trends for Sacramento County, this week it’s all about Placer County. Just like last week’s data, all of these figures and images come directly from MLS and offer a comparison to what the market looked like this time last year.
Let’s get started!
For Sale vs. Sold
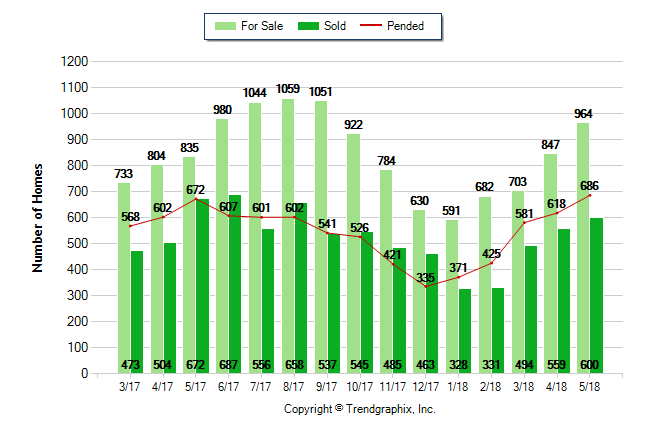
May 2018 is a Seller’s market*
Home For Sale in May 2018: 964 units.
| • | Up 13.8% compared to last month |
| • | Up 15.4% compared to last year |
Home Closed in May 2018: 600 units.
| • | Up 7.3% compared to last month |
| • | Down 10.7% compared to last year |
Home Placed under Contract in May 2018: 686 units.
| • | Up 11% compared to last month |
| • | Up 2.1% compared to last year |
Average Price Per Square Foot
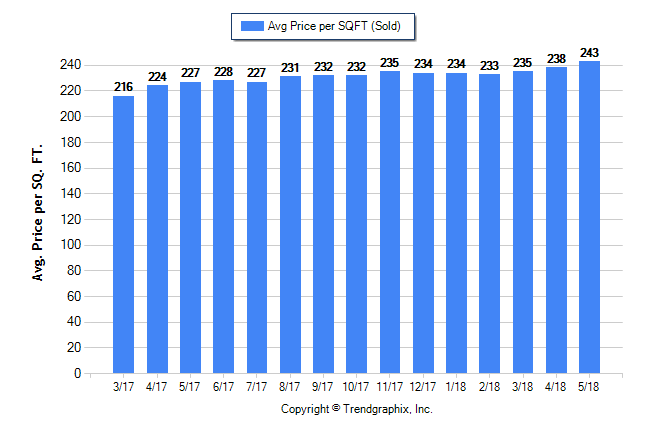
May 2018 Average Sold Price per Square Footage is Appreciating*
Average Sold Price per Square Footage in May 2018: $243
| • | Up 2.1% compared to last month |
| • | Up 7% compared to last year |
Days on Market
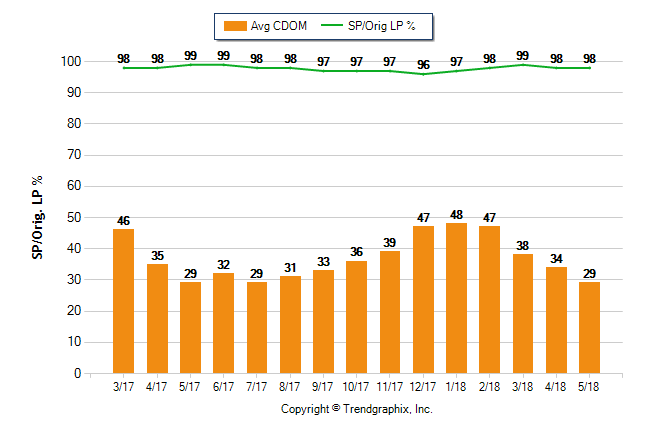
May 2018 Average Continuous Days on Market trend is Falling*
Continuous Days on Market in May 2018: 29
| • | Down 14.7% compared to last month |
| • | 0% compared to last year |
May 2018 Sold/Original List Price Ratio Remains Steady*
Sold/Original List Price % in May 2018: 98%
| • | 0% compared to last month |
| • | Down 1% compared to last year |
Average Price for Sale & Price Sold
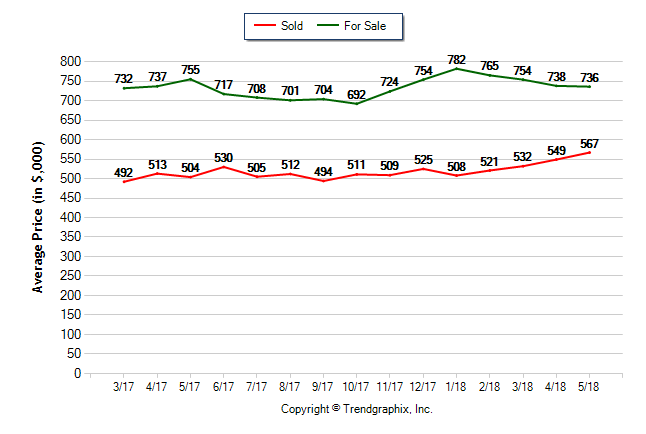
May 2018 Average For Sale Price is Depreciating*
Average For Sale Price (in thousand) in May 2018: $736
| • | Down 0.3% compared to last month |
| • | Down 2.5% compared to last year |
Months of Inventory
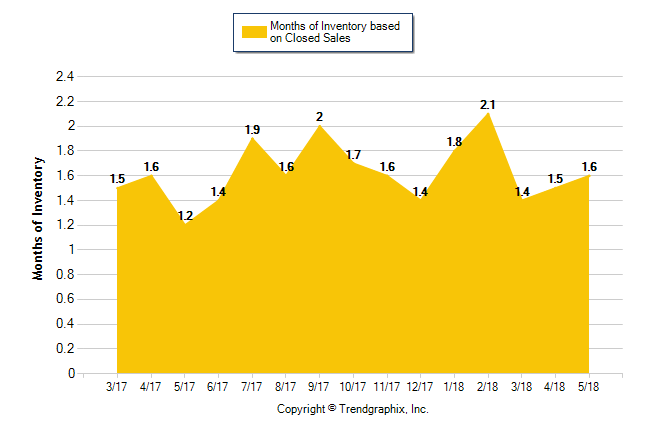
May 2018 is a Seller’s market*
Months of Inventory based on Closed Sales in May 2018: 1.6
| • | Up 6.6% compared to last month |
| • | Up 32.2% compared to last year |