NorCal Homes October Market Update
Despite California year-to-date sales being down 3.7%, October is still being hailed as a Seller’s market.
California single-family home and condominium sales were 35,842 in September 2016, a decline of 10.4 percent from August and a decline of 6.7 percent from 38,397 in September 2015. Year-to-date sales (January through September 2016) totaled 318,757 properties, down 3.7 percent from the same period in 2015. “The normal seasonal sales decline began in September so taking a longer term view gives a complete picture of the market,” said Madeline Schnapp Director of Economic Research for PropertyRadar. “Sales from January through September fell 3.7 percent compared to the same period in 2015, the lowest since 2011. Despite lower sales, prices continue to climb higher albeit at a slower pace than prior years.”
The median price of a California home was nearly unchanged at $434,500 from $435,000 in August but gained 6.6 percent from $407,500 a year ago. The median price of a condominium was $419,000, nearly unchanged from $420,000 in August 2016 but up 6.1 percent from $395,000 in September 2015.
The number of homeowners in a negative equity position fell to approximately 450,000 in September 2016, a decline of nearly 115,000, or 20%, since September 2015.
To read the entire article on Property Radar, click here.
(Source: PropertyRadar)
Home For Sale in October 2016: 2478 units.
| • | Down 9.1% compared to the last month |
| • | Down 7.1% compared to the last year |
Home Closed in October 2016: 1496 units.
| • | Down 9.3% compared to the last month |
| • | Down 1.5% compared to the last year |
Home Placed under Contract in October 2016: 1673 units.
| • | Up 2.4% compared to the last month |
| • | Up 10.1% compared to the last yea |
October 2016 Average Sold Price per Square Footage is Neutral*
Average Sold Price per Square Footage in October 2016:$203
| • | Up 1% compared to the last month |
| • | Up 9.1% compared to the last year |
October 2016 Average Continuous Days on Market trend is Rising*
Continuous Days on Market in October 2016: 32
| • | Up 6.7% compared to the last month |
| • | Down 15.8% compared to the last year |
October 2016 Sold/Original List Price Ratio Remains Steady*
Sold/Original List Price % in October 2016: 98%
| • | 0% compared to the last month |
| • | Up 1% compared to the last year |
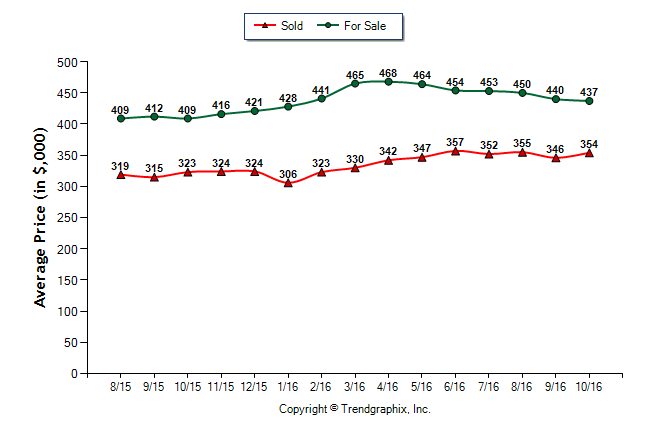
October 2016 Average For Sale Price is Depreciating*
Average For Sale Price (in thousand) in October 2016: $437
| • | Down 0.7% compared to the last month |
| • | Up 6.8% compared to the last year |
October 2016 Average Sold Price is Neutral*
Average Sold Price (in thousand) in October 2016: $354
| • | Up 2.3% compared to the last month |
| • | Up 9.6% compared to the last year |
(Source: MLS)