NorCal Homes August Market Update
 The trend continues! August 2016 continues to bring good things to Seller’s in the Sacramento market, and word is starting to spread. There is a nearly 3% increase in the number of homes on the market compared to last month (but still down from this time last year). The increased supply isn’t slowing down sales, with 11.7% more homes placed under contract, and a 7.4% rise in the number of homes closed from July.
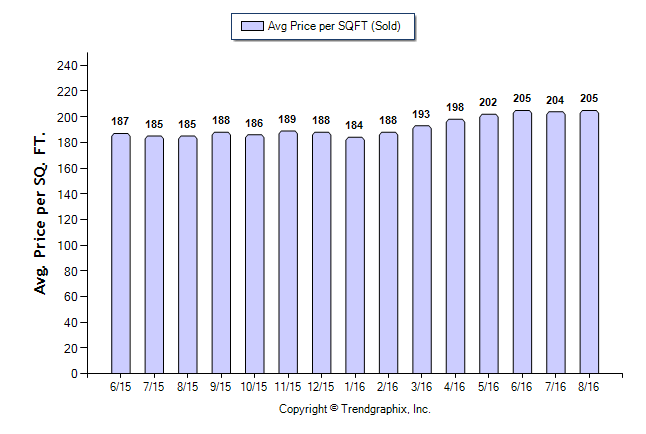
This month shows the average sold price per square foot is slightly appreciating, up .5%, (to $205.00 per sqft) that’s a nearly 11% increase from this time last year. Even though the average sold price has shown a (very) slight upheaval, the sold/original list price ratio is falling, down 3% from last month, closing at an average of 96% of asking. Despite an overall increase in prices, homes are spending less time on the market, with an average 25 continuous active days listed.
If you’re thinking about selling, or are jut interested in learning more about the options available, give us a call! We would love to help. 🙂
Below is a more in-depth breakdown from Sacramento MetroList of the current trends in the area:
Home For Sale in August 2016: 2755 units.
Home Closed in August 2016: 1704 units.
Home Placed under Contract in August 2016: 1935 units.
|
||||||||||||
|
August 2016 Average Sold Price per Square Footage is Appreciating* Average Sold Price per Square Footage in August 2016: $205
August 2016 Average Continuous Days on Market trend is Falling*
August 2016 Sold/Original List Price Ratio is Falling*
|
August 2016 Average For Sale Price is Depreciating*
Average For Sale Price (in thousand) in August 2016: $450
| • | Down 0.7% compared to the last month |
| • | Up 10% compared to the last year |
August 2016 Average Sold Price is Neutral*
Average Sold Price (in thousand) in August 2016: $356
| • | Up 1.1% compared to the last month |
| • | Up 11.6% compared to the last year |
August 2016 is a Seller’s market* Months of Inventory based on Closed Sales in August 2016: 1.6
|