Sacramento County Market Trends
#TuesdayTrend
May Market Trends: Sacramento
This edition of the Tuesday Trend is all about statistics. That’s right, we’re taking it old school. I agree, it’s not as fun as talking about color schemes or bathroom hardware, but it’s equally – if not more – important. Why? Well, it’s all fun and games until there’s no houses to buy and no buyers to sell your house(s) too… am I right or am I right?
So, I thought we’d take a minute to break down the market trend in Sacramento County for the month of May 2018. All of these figures and images come directly from MLS and offer a comparison to what the market looked like this time last year. Let’s dive in…
For Sale vs. Sold
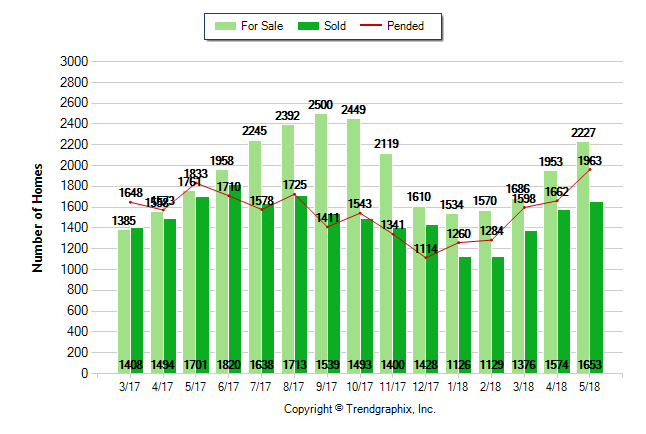
May 2018 is a Seller’s market*
A “Seller’s Market” is defined as: less than 3 months of inventory based on closed sales
Home For Sale in May 2018: 2227 units.
| • | Up 14% compared to last month |
| • | Up 26.5% compared to last year |
Home Closed in May 2018: 1653 units.
| • | Up 5% compared to last month |
| • | Down 2.8% compared to last year |
Home Placed under Contract in May 2018: 1963 units.
| • | Up 18.1% compared to last month |
| • | Up 7.1% compared to last year |
Average Price Per Square Foot
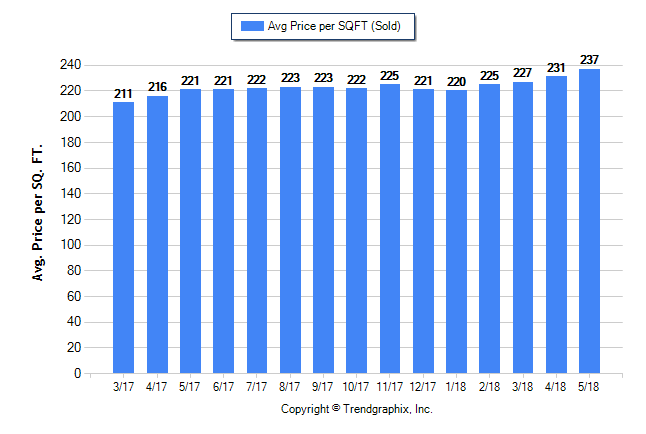
May 2018 Average Sold Price per Square Footage is Appreciating*
Average Sold Price per Square Footage in May 2018: $237
| • | Up 2.6% compared to last month |
| • | Up 7.2% compared to last year |
NorCal Note: This figure is especially interesting to me. $237 per square foot is the county AVERAGE. It is important to note that because this number can vary tremendously by neighborhood. For example, there is currently a house for sale on a prestigious street in East Sacramento that is listed for $628 per square foot. However, near 12th Avenue and 99 there’s a home listed for $206 per square foot. To make these numbers even more mind blowing… these homes are roughly only 3.5 miles apart. Crazy!
Days on Market – Sold/List Price %
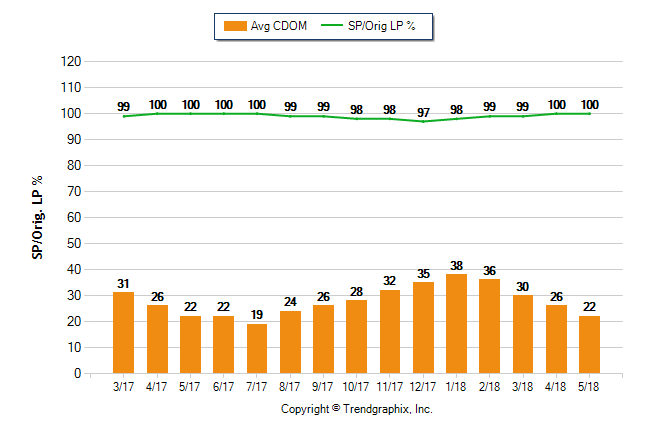
May 2018 Average Continuous Days on Market trend is Falling*
Continuous Days on Market in May 2018: 22
| • | Down 15.4% compared to last month |
| • | 0% compared to last year |
May 2018 Sold/Original List Price Ratio is Rising*
Sold/Original List Price % in May 2018: 100%
| • | 0% compared to last month |
| • | 0% compared to last year |
NorCal Note: This number is interesting because it is EXACTLY where it was this time last year. Taking a look at the graph, you’ll notice that the trend of homes selling quicker during warmer months and staying on the market when the weather isn’t typically as nice. This is pretty normal in the world of Real Estate. It will be interesting to see if this year’s numbers continue to mimic last year’s when we look back at June.
Average Price for Sale and Sold
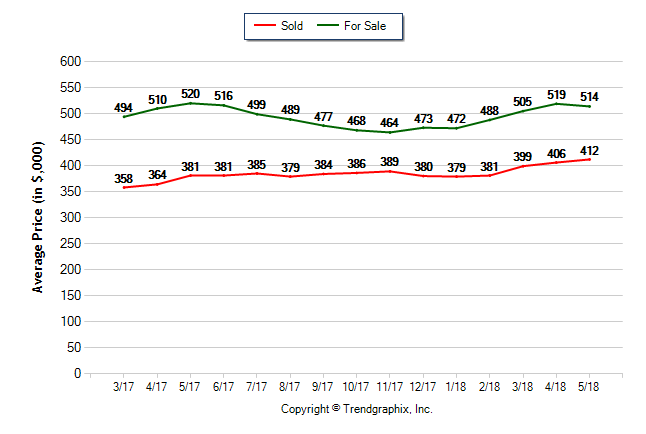
May 2018 Average For Sale Price is Neutral*
Average For Sale Price (in thousand) in May 2018: $514
| • | Down 1% compared to last month |
| • | Down 1.2% compared to last year |
May 2018 Average Sold Price is Appreciating*
Average Sold Price (in thousand) in May 2018: $412
| • | Up 1.5% compared to last month |
| • | Up 8.1% compared to last year |
Month’s of Inventory
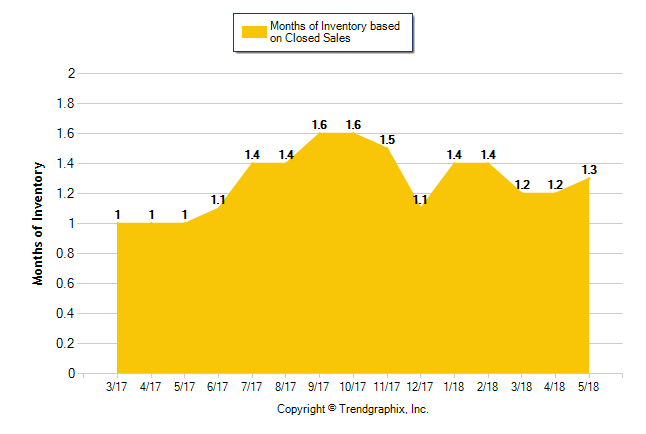
May 2018 is a Seller’s market*
Seller’s market: less than 3 months of inventory based on closed sales
Months of Inventory based on Closed Sales in May 2018: 1.3
| • | Up 8.1% compared to last month |
| • | Up 29% compared to last year |
Months of Inventory based on Closed Sales in May 2018: 1.3
| • | Up 8.1% compared to last month |
| • | Up 29% compared to last year |
Next month, check out our Instagram page to see what the month of June brought for the real estate market in Sacramento County!
@norcalhomesanddevelopment