Yolo County Market Update – June 2018
#TuesdayTrend
June 2018 is a Seller’s market!
Let’s take a look at what June 2018 brought to Yolo County’s Real Estate market! As always, all of these figures and images come directly from MLS and offer a comparison to what the market looked like this time last year.
The number of for sale listings was down 12.3% from one year earlier and up 7.5% from the previous month. The number of sold listings decreased 1.3% year over year and decreased 15.4% month over month. The number of under contract listings was down 10.4% compared to previous month and down 4.6% compared to previous year. The Months of Inventory based on Closed Sales is 1.8, down 14.5% from the previous year.
The Average Sold Price per Square Footage was down 3.4% compared to previous month and up 5.6% compared to last year. The Median Sold Price decreased by 5.5% from last month. The Average Sold Price also decreased by 4.2% from last month. Based on the 6 month trend, the Average Sold Price trend is “Neutral” and the Median Sold Price trend is “Neutral”.
The Average Days on Market showed a neutral trend, an increase of 4.5% compared to previous year. The ratio of Sold Price vs. Original List Price is 99%, a decrease of 1% compared to previous year.
Property Sales (Sold)
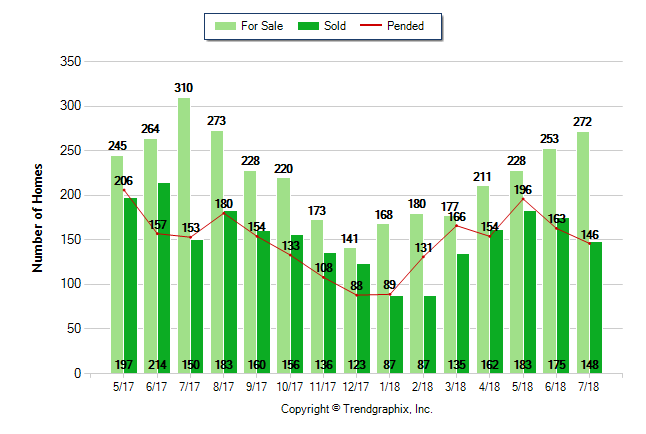
July property sales were 148, down 1.3% from 150 in July of 2017 and 15.4% lower than the 175 sales last month.
Current Inventory (For Sale)
Versus last year, the total number of properties available this month is lower by 38 units of 12.3%. This year’s smaller inventory means that buyers who waited to buy may have smaller selection to choose from. The number of current inventory is up 7.5% compared to the previous month.
Property Under Contract (Pended)
There was a decrease of 10.4% in the pended properties in July, with 146 properties versus 163 last month. This month’s pended property sales were 4.6% lower than at this time last year.
The Average Sold Price per Square Footage is Neutral
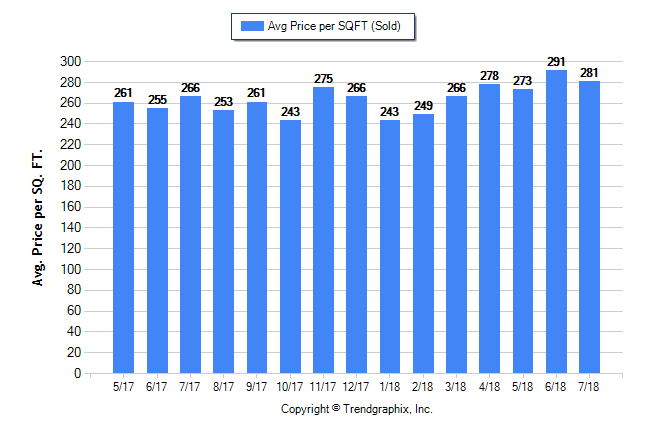
The Average Sold Price per Square Footage is a great indicator for the direction of property values. Since Median Sold Price and Average Sold Price can be impacted by the ‘mix’ of high or low end properties in the market, the Average Sold Price per Square Footage is a more normalized indicator on the direction of property values. The July 2018 Average Sold Price per Square Footage of $281 was down 3.4% from $291 last month and up 5.6% from $266 in July of last year.
The Days on Market Shows Neutral Trend*
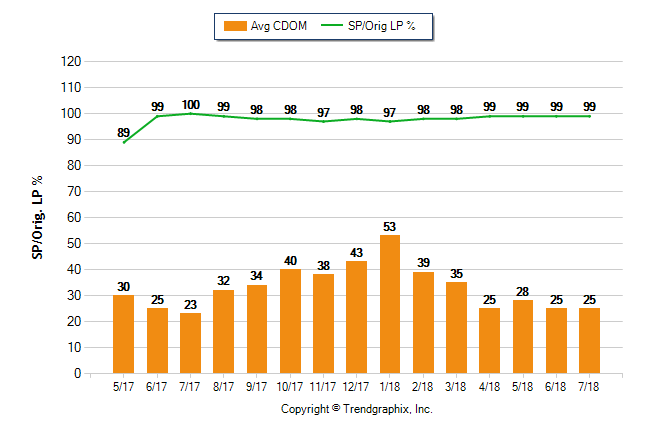
The average Days on Market (DOM) shows how many days the average property is on the market before it sells. An upward trend in DOM trends to indicate a move towards more of a Buyer’s market, a downward trend indicates amove towards more of a Seller’s market. The DOM for July 2018 was 23, the same as last month and up 4.5% from 22 days in July of last year.
The Sold/Original List Price Ratio is Rising
The Sold Price vs. Original List Price reveals the average amount that sellers are agreeing to come down from their original list price. The lower the ratio is below 100% the more of a Buyer’s market exists, a ratio at or above 100% indicates more of a Seller’s market. This month Sold Price vs. Original List Price of 99% is the same as last month and down from 1% % in July of last year.
The Average For Sale Price is Appreciating
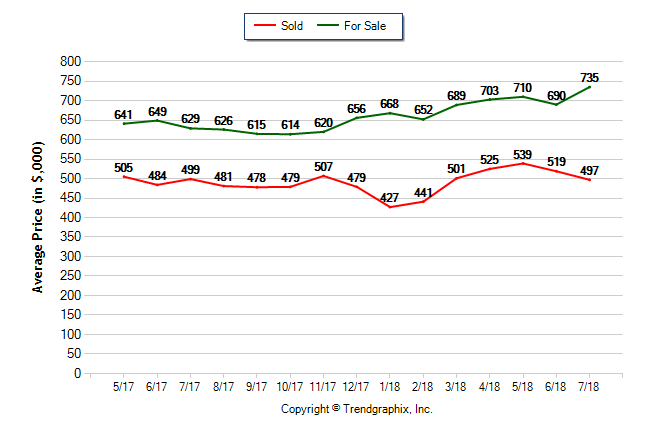 The Average For Sale Price in July was $735,000, up 16.9% from $629,000 in July of 2017 and up 6.5% from $690,000 last month.
The Average Sold Price is Neutral
The Average Sold Price in July was $497,000, down 0.4% from $499,000 in July of 2017 and down 4.2% from $519,000 last month.
The Median Sold Price is Neutral
The Median Sold Price in July was $430,000, up 0.2% from $429,000 in July of 2017 and down 5.5% from $455,000 last month.
It is a Seller’s Market*
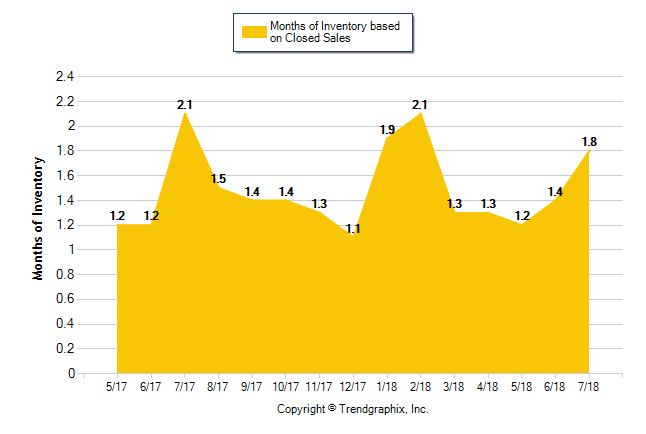
A comparatively lower Months of Inventory is more beneficial for sellers while a higher months of inventory is better for buyers.
*Buyer’s market: more than 6 months of inventory
Seller’s market: less than 3 months of inventory
Neutral market: 3 – 6 months of inventory
Months of Inventory based on Closed Sales
The July 2018 Months of Inventory based on Closed Sales of 1.8 was decreased by 14.5% compared to last year and up 27.7% compared to last month. July 2018 is Seller’s market.
Months of Inventory based on Pended Sales
The July 2018 Months of Inventory based on Pended Sales of 1.9 was decreased by 4.9% compared to last year and up 19.3% compared to last month. July 2018 is Seller’s market.